Enhance your dashboards with exclusive features or seamlessly integrate them with external applications for a more powerful analytics experience.
Trusted by Leading Businesses
Enhance your dashboards with exclusive features or seamlessly integrate them with external applications for a more powerful analytics experience.
Dynamic Dashboard Sync
Discover Dynamic Dashboard Sync by Tableau, the extension that transforms your data flow into a dynamic and interactive environment! Customize forms and seamlessly integrate your preferred APIs, regardless of the programming language.
Monitor and adjust data source values in real time, explore different scenarios, and assess their impact on key business metrics.
This extension empowers you to refine strategies and achieve exceptional results. Enhance decision-making and data analysis with Dynamic Dashboard Sync, turning your data into tangible opportunities for success.
ShowMeMore
The ShowMeMore extension is perfect for adding visualization types that aren’t included in Tableau’s default “Show Me” options.
Need to embed an interactive Sankey diagram to track flows? Looking for a flexible radar chart for HR dashboards? With ShowMeMore, you can even integrate a dynamic network chart into your Tableau dashboard to illustrate organizational structures with ease.
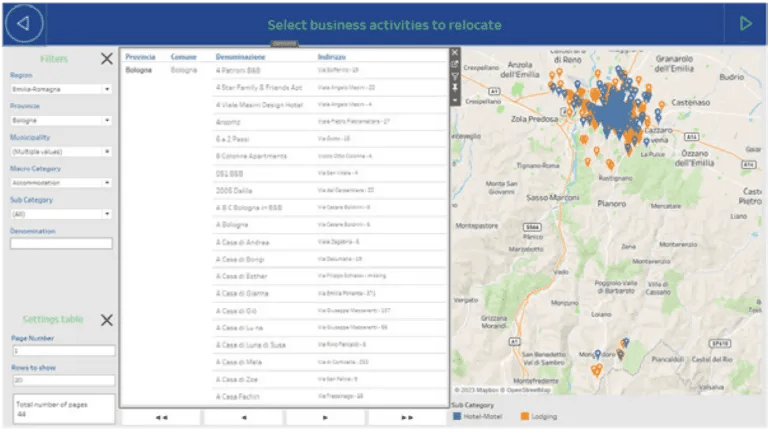
SuperTables
Tables are a widely used feature in Tableau Dashboards, ideal for creating context panes, analyzing hierarchies, or adding detailed insights to visualizations. While Tableau tables provide strong core functionality, they have limitations in areas like grouping and filtering.
With the SuperTables extension, you can empower dashboard users with interactive and dynamic tables, enabling them to customize, organize, and analyze data within a flexible grid for a more tailored experience.
PictureThis
The PictureThis extension enables the use of URLs, images, and background shapes, allowing you to create dynamic image tables that can function as filters within your dashboard.
With this extension, images in dashboards can be sourced from specific datasets and automatically processed to deliver a visually appealing and responsive result, adaptable to any device. These images seamlessly act as filters for other worksheets within the dashboard, enhancing interactivity and user experience.
DashboardGuide
Tableau users are well aware of the power of data analytics and the metadata behind visualizations. But what about the details hidden within the dashboards themselves? With DashboardGuide, there are no more secrets!
The DashboardGuide extension for Tableau helps you save time, enhance presentation quality, and provide essential background information on your dashboards. It allows you to define KPIs, explain objectives, and guide users on how and why the dashboard was developed, ensuring a better understanding and improved user experience.
Usage Dashboard 2.0
To better understand how users interact with dashboards and visualizations, Dashboard Usage is the ideal extension. By analyzing collected data, you can turn dashboards into valuable sources of strategic insights for future decision-making.
Dashboard Usage leverages Google Analytics, the most comprehensive and reliable tool for tracking user activity, including viewed content, clicks, and searches, providing a complete overview of dashboard engagement.
Performance Insight
The key to customer satisfaction lies in delivering high-performance, visually appealing dashboards. That’s why the free Performance Insight extension for Tableau is designed to help creators and developers analyze and optimize dashboard performance effectively.
With Performance Insight, you can gain valuable feedback and insights to enhance speed, responsiveness, and overall user experience, ensuring your dashboards run smoothly and efficiently.